


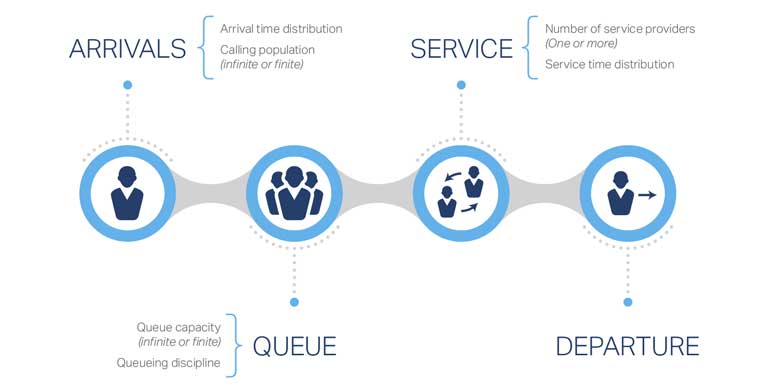
What is Queuing theory? Queueing theory is the mathematical study of waiting lines, or queues. Queueing theory is considered a branch of operations research because the results are often used when making business decisions about the resources needed to provide service.
The theory enables mathematical analysis of several related processes, including arriving at the end of the queue, waiting in the queue (essentially a storage process), and being served at the front of the queue. The theory permits the derivation and calculation of several performance measures including the average waiting time in the queue or the system, the expected number waiting or receiving service, and the probability of encountering the system in certain states, such as empty, full, having an available server or having to wait a certain time to be served.
An everyday phenomenon business leaders can learn from
Queues form when the arrival time of customers or products is faster than their individual service time. The picture below illustrates a simple queue example in which there is one server. Any individual that has been to a bank, a grocery store, a tollbooth, or a fast food restaurant has experienced a queue.
Why is Queueing Theory important for small and medium size companies?
Queueing theory is particularly important to companies that manufacture goods and/or provide services. Throughout the production system, machines/laborers have various service times per component. When entities arrive for machining/processing, if the arrival time is faster than the service time, a queue will form. Where multiple machines exist, the production system could experience multiple queues. Therefore, companies that understand queueing theory and apply corresponding analytical methods will be able to establish clear measures of performance, and subsequently, optimize their machines or operator processing orders, which ultimately lead to greater efficiencies and overall effectiveness. Below are just a few of the terms and characteristics that define a variety of queueing models:
- Entity: This refers to the job, part, customer, etc., that arrives for processing.
- Server (machine or operator): This term refers to the machine, operator, etc., that provides the service. For example, a teller would be the server in a banking queue.
- Arrival Times: As the name implies, this relates to when the entity arrives at the processing station (machine, operator, etc.). Arrival times can either be deterministic (i.e. constant) or stochastic (i.e. random). When arrival times are stochastic, probability distribution are frequently used to extract certain performance measures. Companies prefer deterministic arrival times because it simplifies ordering and inventory requirements. Unfortunately, that is not always the case.
- Service Times: Likewise, service times can also be deterministic or stochastic. Typically, machines are more likely to have deterministic service times given arrival of a common part and set machining requirements. Operators, on the other hand, are far more likely to have stochastic service times given human nature.
- Queue Length: Queues can be either finite or infinite based on space limitations. Most common queues are finite in length.
- Number of Servers: Based on the production and service requirements, the number of servers can vary within a company. Using a bank again as an example, when the number of customers waiting in the queue grows, good banks will open up additional teller spots. In production systems, companies may choose to add additional machines when server utilization exceeds an established threshold. Of course, there is always a price to pay when adding servers.
- Service Discipline: This refers to the order in which entities move from a queue to server. The most common rule is FIFO (First In, First Out). However, there are times in which LIFO (Last in, First Out) may be optimum.
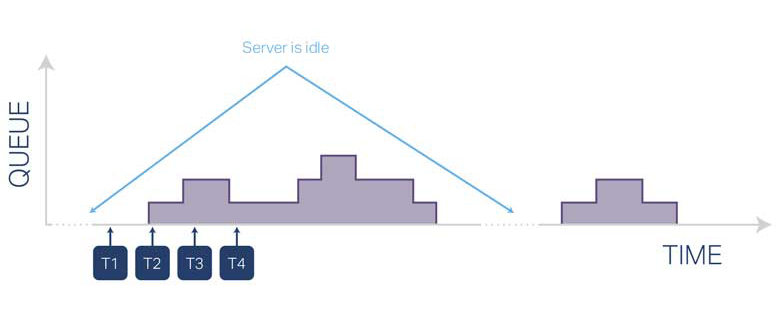
This queuing model consists of single server and an infinite queue. The graph below depicts the arrival of entities and servicing of entities over time. Illustrated within the graph are stochastic arrival times and stochastic service times as well as times when the server is idle. At “t1” the first entity arrives. Given that the server is idle, the number in the queue is zero. At “t2” and “t3” additional entities arrive. Given the server is still processing the first entity, a queue forms and grows with each arrival. At “t4” service is completed on the first entity and processing begins on the next entity thus reducing the size of the queue. The process continues with subsequent arrivals and service completions. Charting queue size over time will allow companies to accurately determine one key measure of performance – Server Utilization, which can be calculated as a percentage of non-idle time divided by total time. Other key measures of performance are listed below.
Measures of Performance:
- Mean (Average) waiting time in queue
- Percentile of the waiting time in queue
- Server Utilization
- Total Throughput
- Average number of products/customers waiting
- Stability: A queue is stable when the number of waiting customers or products does not move toward infinity. In a single-server queue, the queue is stable if the average service time is less than the average inter-arrival time.
In situations where arrival and service times are stochastic, probability theory is used to determine “best fit” distributions, which can be used in modeling scenarios. As far as software solutions, there are a number of programs that allow companies to simulate various queueing models, which assists in steady state analysis.
Queueing Theory can provide critical insights into areas such as:
- Inventory modeling
- Layout of production lines
- Priorities for machining
- Other areas where companies experience the formation of queues
Remember, Operations Research techniques are designed to provide Scientific Solutions to company problems. However, it is by great leadership and management where companies obtain the competitive advantage. OSI can assist you in optimizing both.