


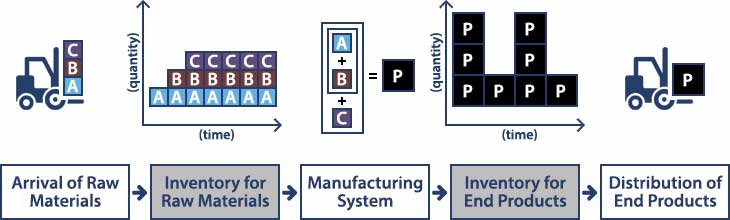
The discussion that follows is based on a simple production system consisting of a limited number of raw materials (A, B, and C); a manufacturing system; a single end product (P); and a simple end‐product distribution system, all of which are depicted in the figure below. The two gray boxes represent the major inventory considerations that mathematically translate to temporary storage‐space requirements and associated overhead costs. The illustrations above the two inventory boxes attempt to capture the notion that inventory quantities change over time as raw materials arrive and end products are completed and shipped. (Note: The use of a simple production system allows us to capture the key components within the production system, identify related processes and variables, and conduct mathematical analysis. From there, advanced systems can be developed and analyzed in a similar fashion.)
Why is supply chain management important for small and medium-sized companies?
One of the biggest challenges that they will face, especially when in a start‐up or restructuring mode, is identifying their inventory needs and implementing an effective supply chain management process. In the beginning, it seems like a simple process. The stories that we have heard in the past go something like this:
Production Goal ‐ Near Zero Inventory:
- Description: In this scenario, the company leadership’s number one priority is to keep inventory as small as possible. The most common way to achieve this extreme involves “Just‐in‐Time” arrival of raw materials, followed by the immediate manufacturing of the end product and near simultaneous shipment to vendors upon completion of product packaging. In essence, small batches of raw material and end products are occupying space within the constrained workspace.
- OR Techniques: Given the “Just‐in‐Time” arrival philosophy, raw materials should be scheduled to arrive when required. Here, the key word is “scheduled.” Therefore, Program Evaluation and Review Technique (PERT) and/or Gantt Charting should be used, which focus on production schedules and slack times. PERT is a statistical tool, used in project management, which is designed to analyze and represent the tasks involved in completing a given project. A Gantt chart is a type of bar chart, developed by Henry Gantt that illustrates a project schedule. Gantt charts illustrate the start and finish dates of the terminal elements and summary elements of a project. Terminal elements and summary elements comprise the work breakdown structure of the project. Some Gantt charts also show the dependency (i.e., precedence network) relationships between activities. The figure below illustrates how differences in “prep time” of the different parts and the sequencing of production can dictate when certain raw materials need to be available.
- Systemic Impact: While this extreme appears desirable, the transportation costs associated with delivery of raw materials and distribution of end products will be excessive. Furthermore, this production goal leaves very little room for unexpected changes in production levels due to either additional orders or production line failures.

Production Goal - Minimize Distribution Costs:
- Description: In this scenario, the company leadership’s number one priority is to keep the costs associated with the delivery of the raw materials and distribution of the end products at a minimum. As such, inventory levels of the raw materials and end products are of little concern as long as the space is available.
- OR Technique: The company is actually looking to maximize utilization of available storage space. Therefore, the situation becomes one of combinatorial optimization and a solution can be found by restructuring the situation as a Knapsack Problem.
- Systemic Impact: While this appears to be a rather simple approach to the inventory problem, space can be costly. Furthermore, production levels become dependent on available space in that the company cannot make the product unless there is a place to store it before shipping.
It does not take long to realize that the optimal solution to a company’s inventory management lies somewhere between these two extremes. Additional OR techniques are available to provide the decision makers mathematical solutions to their inventory concerns. The most common approach is to determine the Economic Order Quantity (EOQ), which is the order quantity that minimizes total inventory holding costs and ordering costs. It is one of the oldest classical production scheduling models.
EOQ applies only when:
- Demand for a product is constant over the year.
- Each new order is delivered in full when inventory reaches zero.
- There is a fixed cost for each order placed, regardless of the number of units ordered.
- There a cost for each unit held in storage2.
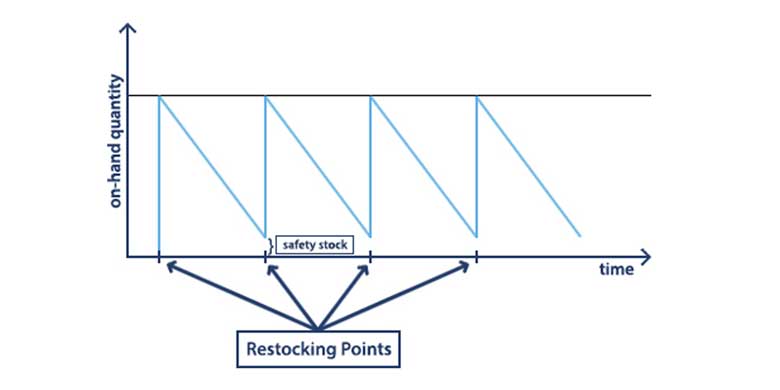
The graphic below is one visual representation of the EOQ over time. The light blue vertical lines represent the arrival of a new order whereas the light blue diagonal lines represent the constant demand. This particular representation introduces one additional planning factor (modification to EOQ) known as safety stock, which is determined by the management.
The variables required to determine a company’s EOQ are:
- Order Quantity
- Annual Demand Quantity
- Fixed Cost per Order
- Annual Holding Costs
However, rarely do things remain constant, but there is still hope for management. Dynamic Lot Size Models exist that are designed to address varying demand, varying costs, multiple customers, etc.
In closing, company management should always be prepared for the “rainy day” scenarios whether it be from production line failures, transportation problems, surge orders, etc. OR Techniques are designed to provide “Scientific Solutions” to company problems, however it is by great leadership and management where companies obtain the competitive advantage. Open Source Integrators can help you maximize both.
1 Wikipedia: The Free Encyclopedia, https://en.wikipedia.org/wiki/Inventory_models, accessed 4 June, 2012.
2 Wikipedia: The Free Encyclopedia, https://en.wikipedia.org/wiki/Economic_order_quantity, accessed 6 June, 2012


